



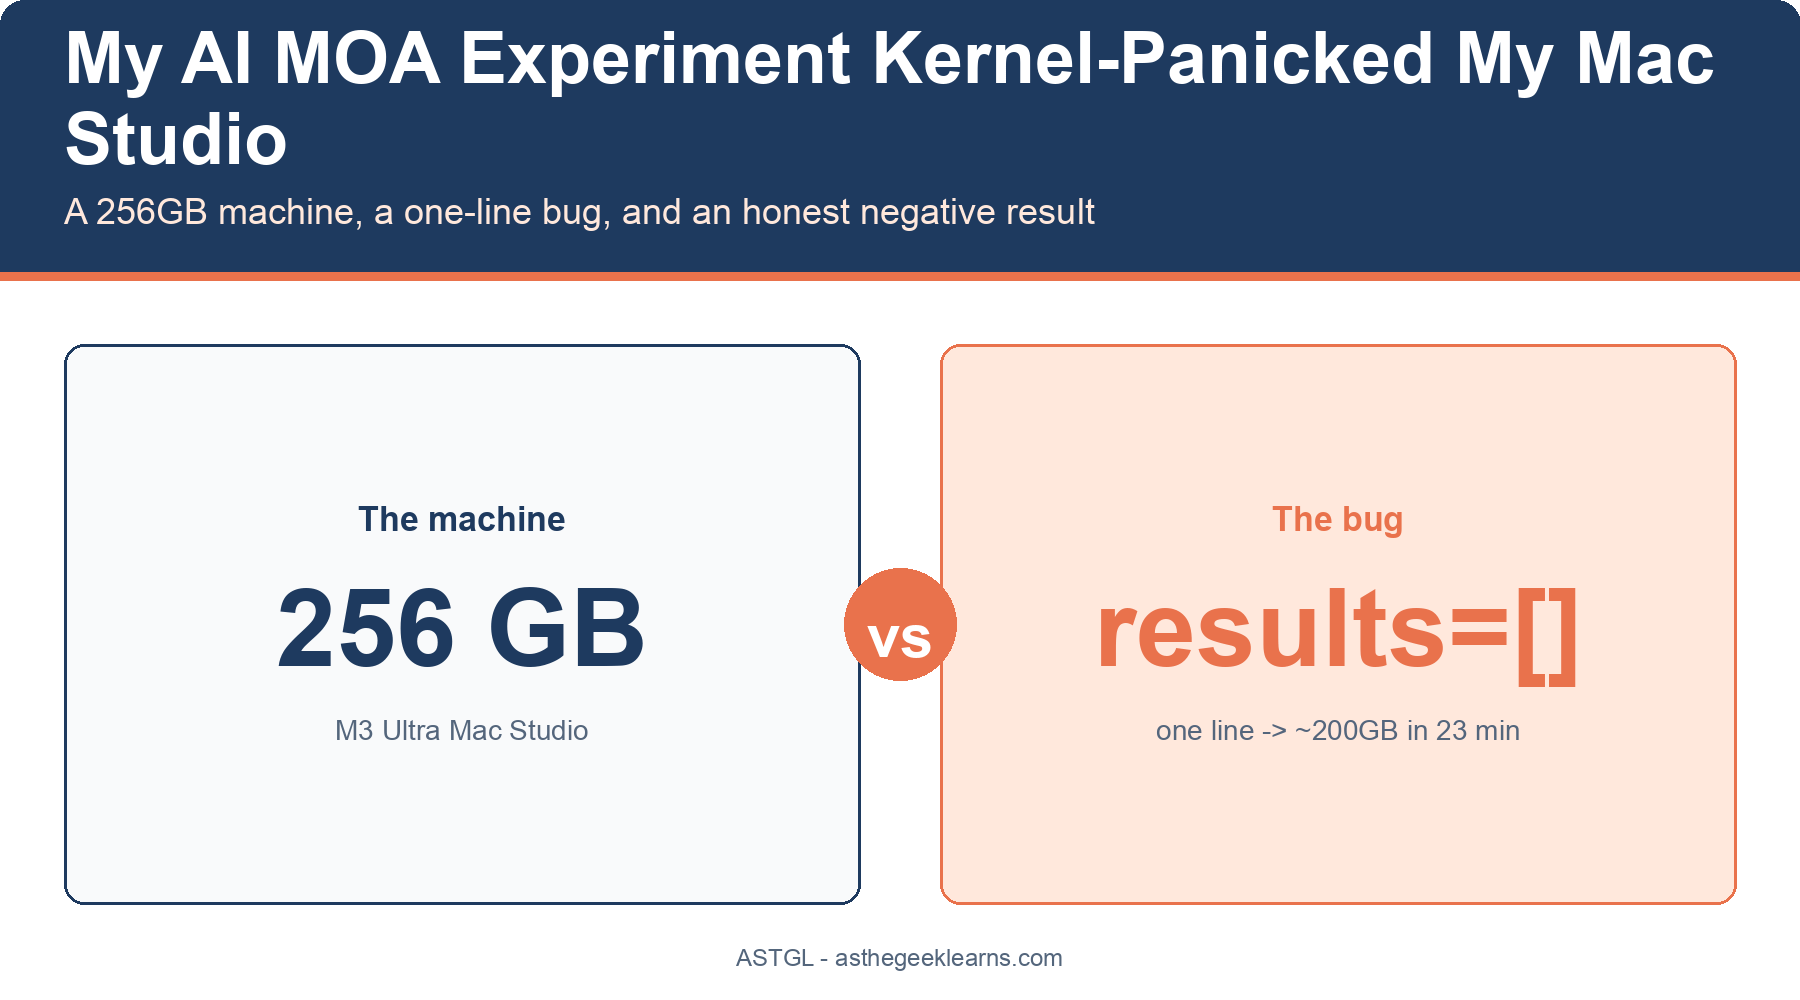
I set out to test whether a crowd of AI models writes better code than one good one. The experiment said no. Getting to that no involved crashing my Mac Studio three times, watching my AI assistant confidently blame the wrong thing, and catching it with the kernel's own flight recorder. This is the story of the crash, the one-line bug behind it, and why the unglamorous part was what mattered.
A machine with 256 GB of RAM should not run out of memory. Mine did. Three times in two days, and every time it happened during the part of the run I'd written off as the safe part: no AI models loaded, no network calls, just a script re-reading a results file I already had on disk. The screen would freeze, the fans would spin up, and then macOS would reboot itself and hand me a panic report. I want to walk you through how I proved it was my code and not my hardware, because the method matters more than the bug.
What I was actually testing
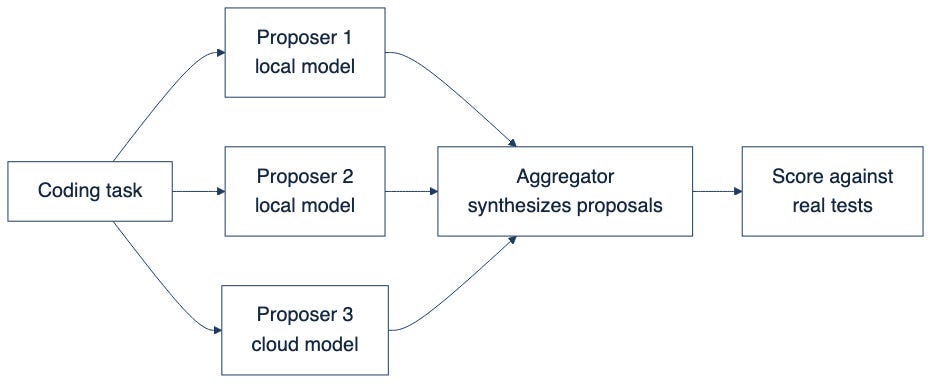
The project is a benchmark. There's a paper making the rounds called Mixture of Agents, or MoA. The idea is appealing: instead of asking one strong model to write code, you ask several models to each propose a solution, then a final "aggregator" model synthesizes their proposals into one answer. More heads, better output. I wanted to know if that holds up on real coding tasks, at equal cost, running mostly on local models on my Mac Studio. So I built a harness that fans a task out to several proposers, merges the results, and scores the merged code against real tests.
I did one thing up front that saved me later. Before running anything, I froze the whole experimental design in a decision record: the exact tasks, the token budget, and the statistical rule for calling a winner. Preregistration. It felt like overkill for a personal project. It wasn't.

The safe part crashed the machine
Phase 2 finished, and the answer was already leaning negative, so I moved on to attribution runs to understand why. One of those was pure re-analysis. It re-reads an existing results file and splits it by task difficulty. No model calls at all. It's the lightest thing in the whole codebase.
It kernel-panicked the Mac. Twice more after that.
The obvious move is to blame load. Close the background apps, kill the backup daemon, and blame Spotlight. My AI pair programmer went straight there and told me the culprit was probably concurrent memory pressure from other processes. Confident, plausible, and completely backwards.
Reading the kernel's black box
macOS writes a panic report when it crashes, and buried in it is a stackshot: a snapshot of every process at the moment of death. This is the black box recorder, and most people never open it. The file was in a folder that's easy to miss, /Library/Logs/DiagnosticReports/Retired/.
One process stood out. A Python process, pid 14869, sitting at 1,279 seconds of user CPU time, 48 GB resident, and only 430 page-ins. That last number is the tell. A process that's a victim of memory pressure shows heavy paging as the system thrashes to feed it. This process had almost none. High CPU, low paging: that's not a victim starving for memory. That's a program burning the processor in a tight loop, allocating as fast as it can. The evidence pointed at my code, not the environment.
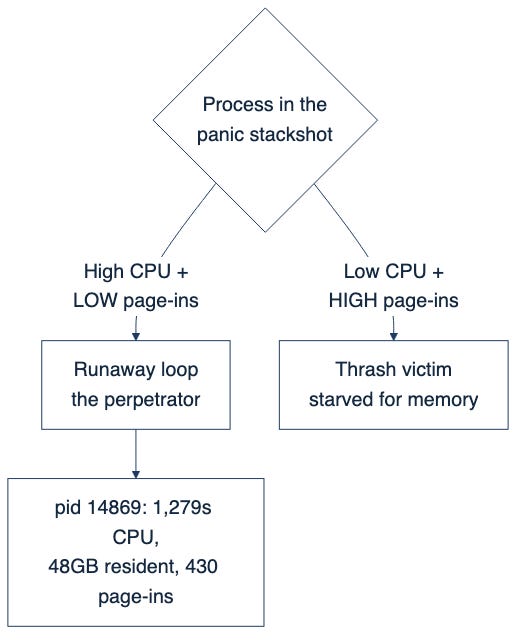
So I did the thing I should always do when the AI and I disagree. I asked for an adversarial review. Three separate review agents, each told to attack a different part of my diagnosis and try to break it. One of them found the stackshot line that settled it. The backup daemon everyone wanted to blame was using half a gigabyte. It was innocent, and I could prove it from the report instead of superstitiously killing it.

The one-line bug
Here's the whole thing. The analysis code built a filtered copy of the results using Python's dataclasses.replace(). What I forgot is that replace() copies field references, not the data behind them. My "copy" shared the original's list. So the loop was appending rows to the exact list it was iterating over. Every row it added matched the filter and got added again. An infinite, self-feeding loop that allocated roughly 200 GB in about 23 minutes until the memory compressor gave out and the kernel panicked.
# replace() copies field *references*, so without results=[] the
# "filtered" run shares the source's mutable list, and the loop below
# appends to the very list it's iterating. Unbounded growth until the
# memory compressor runs out of segments and the kernel panics.
filtered = FactorialResults(
    run=replace(results.run, task_ids=tuple(sorted(task_ids)), results=[]),
)
The fix is results=[]. Two words. My first diagnosis failed because I reasoned about the algorithm as I designed it ("this can't allocate 256 GB, that's impossible") instead of the code as I actually wrote it.
The next crash was a different kind entirely
I built a memory watchdog so this couldn't happen again. The very next run wedged. No panic this time. Memory sat at 98% free for over two hours while the run produced nothing. My shiny new watchdog never fired, because it only knew how to watch for memory trouble, and this wasn't memory trouble.
It was a Unix job-control deadlock. A grading subprocess ran some model-generated code that happened to read from standard input, and because the whole run lived in a background process group, reading the terminal suspended the entire group with a SIGTTIN signal. The fix was structural, not another alarm: hand every subprocess stdin=subprocess.DEVNULL so untrusted generated code can never touch the terminal. That's the real lesson from the pair of incidents. Monitoring only catches the failure classes you already imagined. The next failure is always a new class.

The result was no, and that's the point
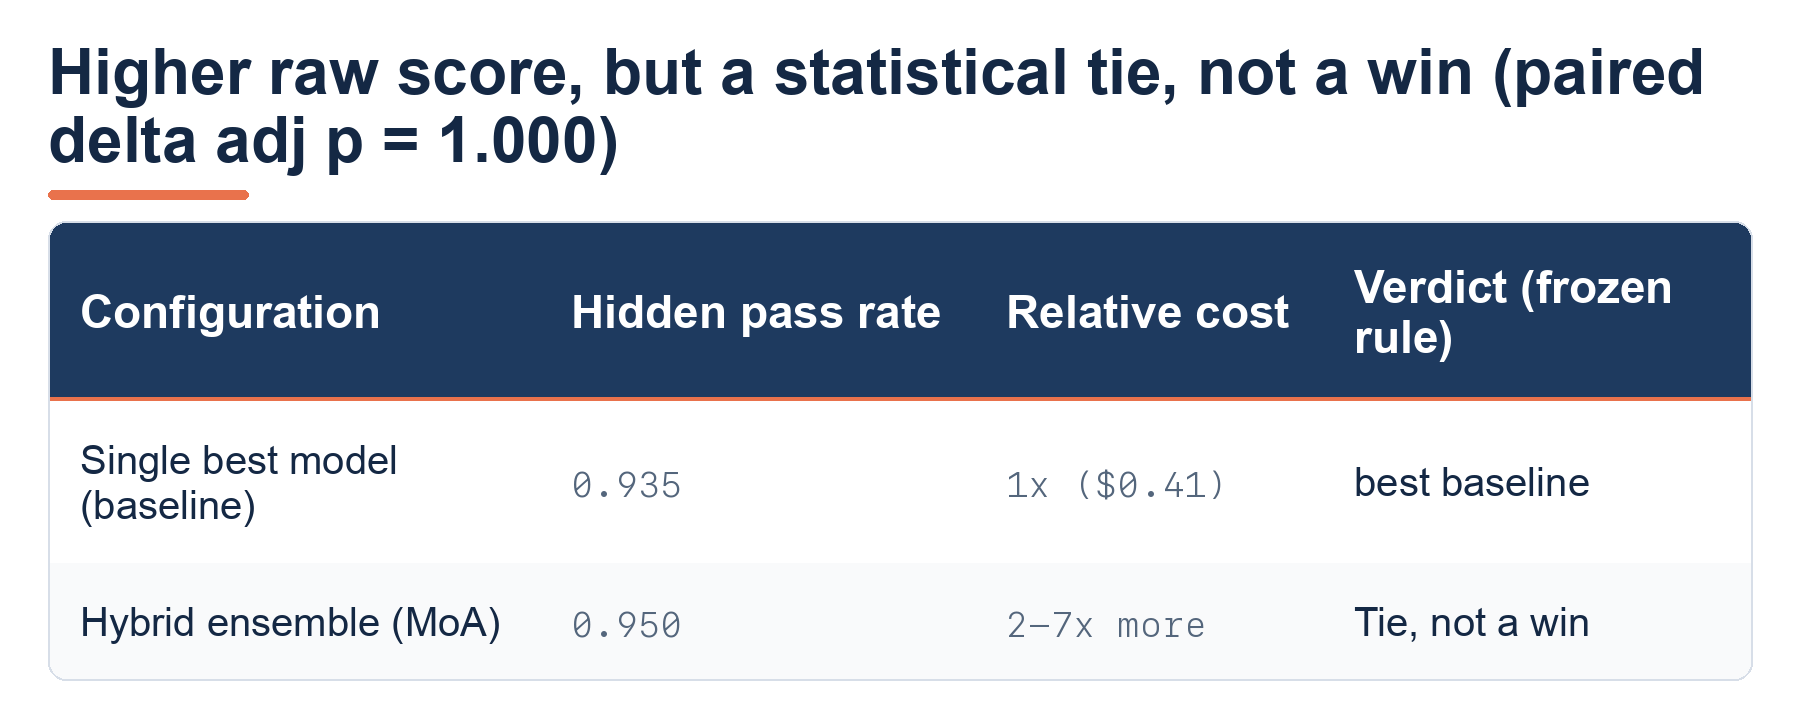
After all of that, the benchmark's answer was clean and disappointing: the crowd of models did not beat the single best model at equal cost. Not on easy tasks, not on hard ones, not with a stronger aggregator, not with a bigger budget. Every ensemble arm cost two to seven times more to be, at best, statistically tied.
And this is where the boring discipline paid off. One configuration's raw score, 0.950, actually sat above the best single model at 0.935. It would have been so easy to write the headline "hybrid AI matches the cloud at half the cost." But the frozen rule I'd written weeks earlier said to compare paired differences, and that difference wasn't significant. Under my own preregistered rule, it was a tie, not a win. The rule existed precisely to stop me from believing a number I wanted to believe.
That's the whole thread. The same discipline that let me overrule my AI's confident wrong guess is what stopped me from overruling my own honest result. A rigorously produced "no" is a real deliverable.

Quick Reference
Read the panic report before blaming load. Stackshots live in
/Library/Logs/DiagnosticReports/(check theRetired/subfolder too).High CPU plus low page-ins means a runaway loop, not a memory victim. The paging counter tells you which.
dataclasses.replace()copies references. Pass a fresh value for any mutable field you don't want shared.Give untrusted or generated subprocesses
stdin=subprocess.DEVNULLso they can't wedge on the terminal.Freeze your decision rule before you see the data. It's cheap insurance against believing your own hype.
Found this useful? I share practical lessons from my systems engineering journey into AI at As The Geek Learns
That's an interesting experiment!
The distinction you landed on is the one most agent demos skip: a panic during the unsafe part of a bench is a bug report, a panic during the safe part is a hardware story. Parallel local MOA is quietly brutal on machines too. When multi-agent pipelines get built for production use (I make custom AI agents at neu Intelligence, https://neu.ie) it is worth keeping orchestration and the heavy model calls on separate hosts: one runaway worker should degrade a queue, not take down the box the other workers live on. Curious whether the panics lined up with a specific model loading, or whether any worker could trigger it.